Santa Barbara's nature-based 'Sense of Place', as told by twitter
This is a cross-posting of the original Blog from Jamie Montgomery: https://www.jamiecmontgomery.com/post/santa-barbara-twitter/
The aim of this project was to evaluate whether or not geotagged social media data can be useful in providing insight into a region’s “Sense of Place” using Santa Barbara as a case study.
How and where people experience and value coastal and ocean areas can reveal places we deem special. Sense of place can be defined as the connection people feel to their geographic surroundings, including both the natural and built environment. Locations with a strong sense of place often have a strong identity felt by both locals and visitors. Sense of place is important for the well-being of both people and the places we value because we are likely to take better care of places that are most important to us.
Sense of place has been qualitatively studied over time, but more quantitative studies have been lacking due to limited data. Thanks to location-based social media data we now have unprecedented amounts of location and sentiment data, allowing more quantitative exploration of the shared meaning of place.
This project used geotagged twitter data from Santa Barbara, California to see if we can measure Sense of Place with social media data. Specifically I used the data to:
- look at how people use natural spaces
- understand spatial patterns of different user-groups (tourists and locals)
- apply a sentiment analysis to learn how positive or negative nature-based tweets are over time within Santa Barbara.
Why Santa Barbara?
The easy answer - I live here! Since I know the city and surrounding areas rather well, I could quickly look at spatial patterns and know what is happening in different locations. The total number of tweets coming from Santa Barbara is also more manageable compared to a much larger, urban city. Additionally, this project was done to look specifically at coastal Sense of Place, requiring a location along the coast.
Also, Santa Barbara is known for being a tourist town, and having beautiful natural and built landscapes (ok - I might be a bit biased here) and therefore provides a unique opportunity to look at two distinct “user-groups” (tourists and locals).
Findings
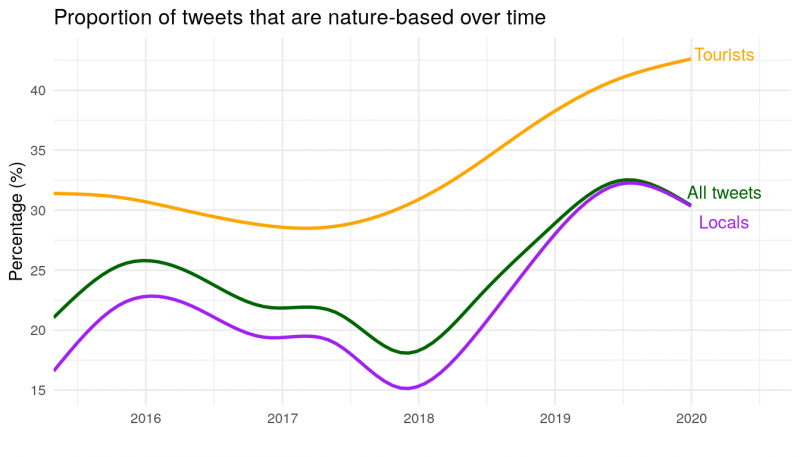
Not surprisingly, tourists and locals both tweet about nature. Tourists tweet about nature more - nearly 42% of all tourist tweets were nature-based, compared to 30% of local tweets. Spatial patterns reveal that tourists tend to stick to popular tourist sites in town including the wharf, waterfront, zoo, santa barbara bowl and more. Santa Barbara locals are also found at these sites just not as in high a proportion. Overall there is significant overlap in tourist and local patterns within the downtown area, indicating that tourists and locals alike share a fondness for the same areas and things.
This project proves that geotagged twitter data gives you the opportunity to examine how people move within a region, what they care about at certain areas and how user-groups align. Since “Sense of Place” is such a difficult concept to quantify, I think the power of an analysis like this lies in comparison to other regions. If we see that Santa Barbara has a higher than normal rate of visitation to natural areas, or positive sentiment around nature-based tweets compared to other similar regions then maybe we can feel more confident in saying that Santa Barbara has a strong nature-based Sense of Place.
Getting twitter data
When I started working on this I thought that twitter data would be easily accessibly based on the number of different projects I had been seeing that used Twitter data and related R packages. But I quickly learned that this was not the case and Twitter only allows free public access to past 9 days of tweets. This was a problem since we wanted all tweets from January 1, 2015 - December 31, 2019.
Twitter data was obtained freely through an established partnership between UCSB Library and Crimson Hexagon. Before downloading, the data was queried to meet the following conditions:
- Tweet came from the Santa Barbara area
- Only original tweets (no retweets)
- Date was marked between January 1, 2015 and December 31, 2019
Crimson Hexagon only allows 10,000 randomly selected tweets to be exported, manually, at a time in .xls format. Due to this restriction, data was manually downloaded for every 2 days in order to capture all tweets (😓). This took a significant amount of point and click time as you can imagine!
Once downloaded, the twitter data did not contain all desired information, including whether or not the tweet was geotagged which was vital to this project. To get this information I stepped outside of my R comfort zone and used the python twarc library. This library can be used to “rehydrate” twitter data using individual tweet ids, and then store all associated tweet information as .json files. From here I was able to remove all tweets that did not have a geotag, giving a total of 79,981 tweets.
Some recent good news! Twitter recently changed their policy for academics looking to use twitter data in their research 🙌🏻! This is great news for anyone looking to use historical twitter data in their research without the funds to purchase access.
Data overview
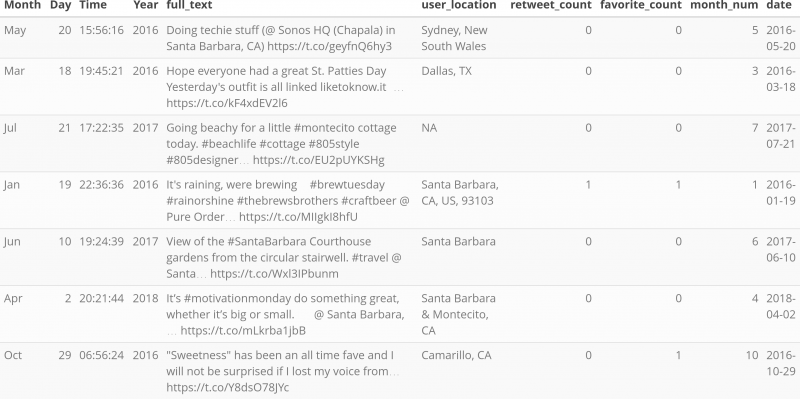
The dataset contained 21811 tweets from tourists, 45420 tweets from locals (32% and 68%). There are 12460 unique tourists and just 1893 unique local users.
Here is a sample of the tweet data:
Tweets over time
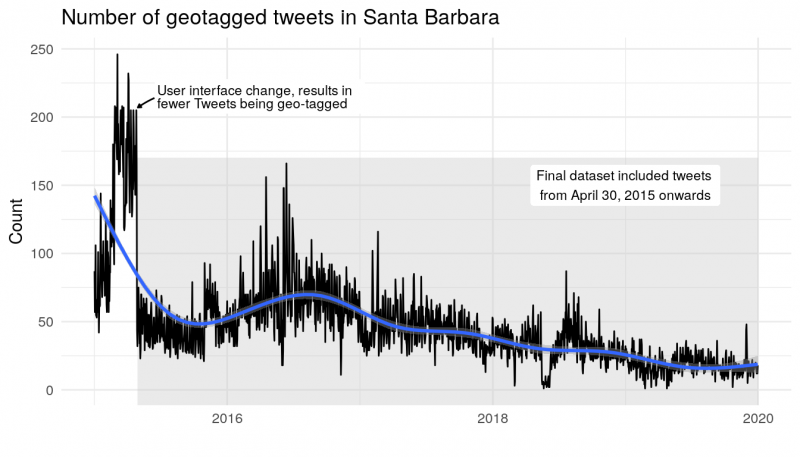
The total number of geotagged tweets is going down over time and, most noticeably, there is a significant drop in tweets at the end of April, 2015. It seems this is due “a change in Twitter’s ‘post Tweet’ user-interface design results in fewer Tweets being geo-tagged” (source). The first 4 months of 2015 have 15,720 tweets, or roughly 19% of all tweets. To reduce a skew in the data and remove geotagged tweets that may have been geotagged without knowledge by the user in those months, I moved forward with all tweets from May 1, 2015 through the end of 2019.
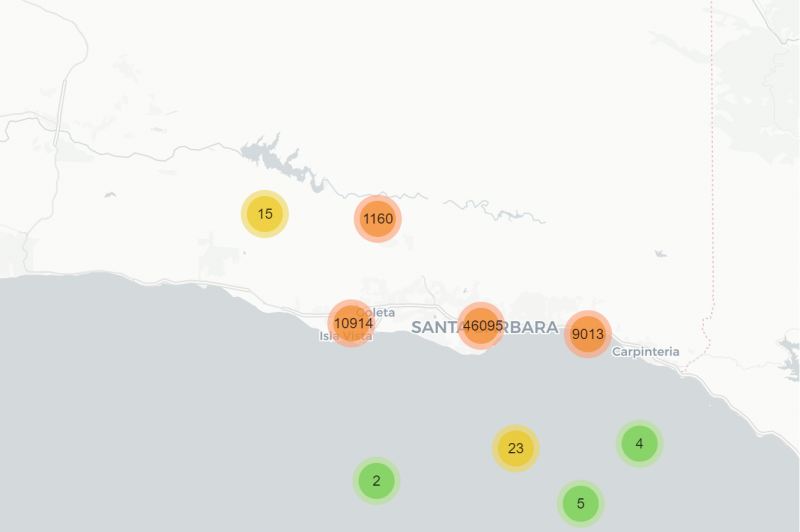
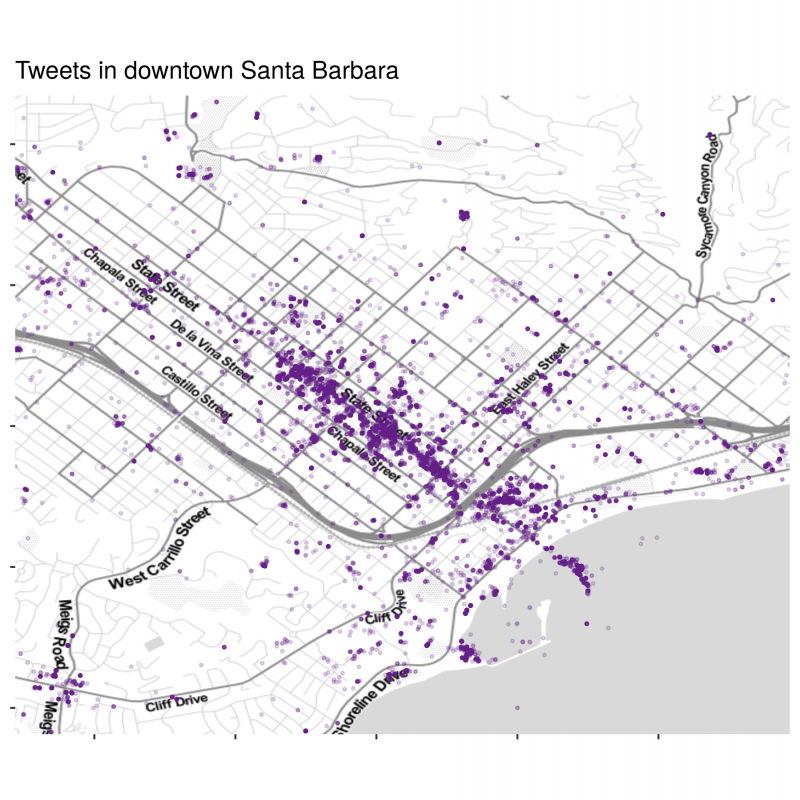
Tweet map
The majority of tweets align with regional centers of Santa Barbara, Isla Vista (home to UCSB), Santa Ynez Valley and the unincorporated areas of Montecito, Summerland and Carpinteria.
Defining tourists & locals
This project aimed to understand if and how preferences differ between tourists and locals for nature-based places within the Santa Barbara area. In order to test this I needed to come up with a way to identify tourists or locals. I ended up using a two step process:
- If the user has self-identified their location as somewhere in the Santa Barbara area, they are designated a local. This includes Carpinteria, Santa Barbara, Montecito, Goleta, Gaviota and UCSB
- For the remainder, we use the number of times they have tweeted from Santa Barbara within a year to designate user type. If someone has tweeted across more than 2 months in the same year from Santa Barbara, they are identified as a local. This is consistent with how Eric Fischer determined tourists in his work.
This is not fool-proof and there are definitely instances where people visit and tweet from Santa Barbara more than two months a year, especially if they are visiting family or live within a couple hours driving distance, but without more data (and time) to determine where “tourists” truly live, this will have to do.
What tweets are “nature-based”?
The next step was to understand how these two groups engage with the natural environment within Santa Barbara, and whether or not patterns through time and space could be used to understand what is and is not important to tourists & locals.
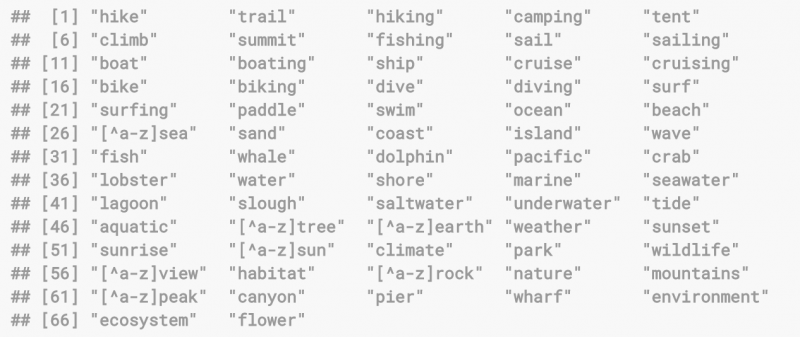
Ideally I would’ve used an established nature “lexicon” (definition: the vocabulary of a language, an individual speaker or group of speakers, or a subject) but my search for such a thing turned up empty. So, I created my own dictionary of 67 words that I think would qualify a tweet as being “nature-based”. These include recreational words, natural features, animals, and environmental words. I fully recognize this is a dictionary that is biased towards my view of nature-based words and tailored to best capture Santa Barbara centric tweets. I would not recommend this dictionary be used for other non-coastal California areas.
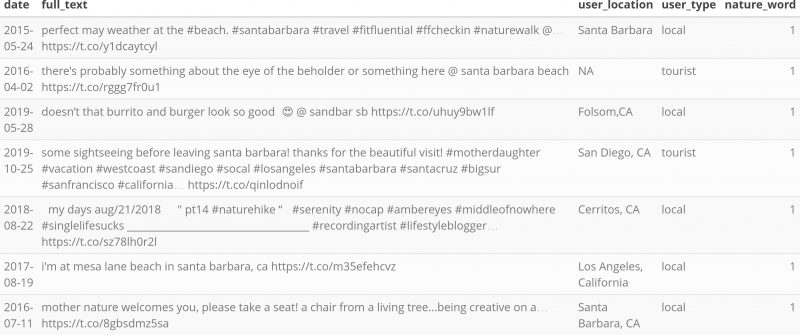
Let’s look at some examples of what tweets qualified as “nature-based”. Most of these are in fact nature-based but clearly the third one about burritos and burgers is not. It looks like this tweet was tagged at a local restaurant called “Sandbar” which is why it gets marked as having a nature word (“sand”). This group of tweets also highlights some of the issues with how we assigned locals and tourists. That same user lists their location as “Folsom, CA” which is 6 hours from Santa Barbara. But my method assigned this person as a local which means they must have tweeted from Santa Barbara in at least 3 unique months in a year. One reason for this may be that students at SB City College or UC Santa Barbara are local for most of the year but still use their home location in their twitter profile 🤷.
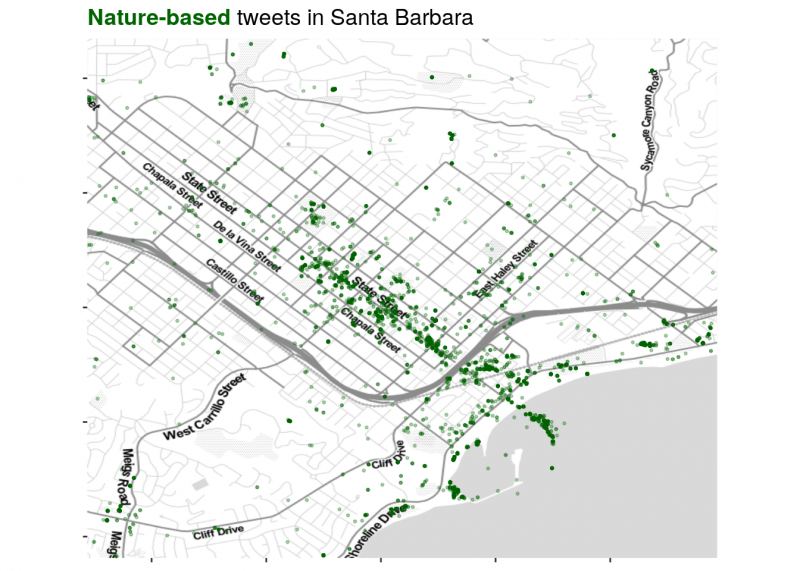
Again, we see most of the nature-based tweets in Santa Barbara are clustered around high density population centers including State Street, the harbor and the wharf.
Are tweets in natural areas more often nature-based?
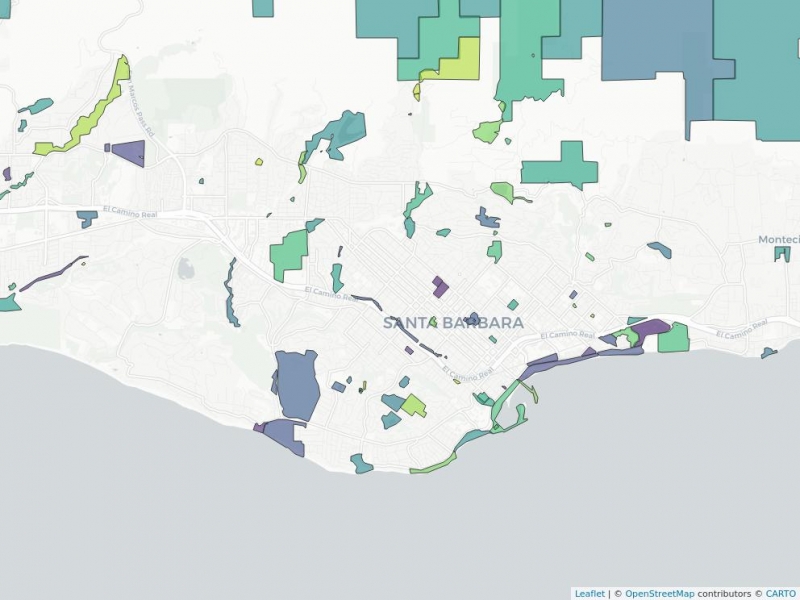
You would think yes, but this dataset gives us an opportunity to look at what is being tweeted from areas that are designated as “protected” by using the California Protected Areas Database. The use of the word “protected” here is a bit loose and includes areas like the Santa Barbara Bowl (an outdoor music venue), and a maritime museum. But, generally, these designated areas are known for their access to nature.
You can see the designated areas within the southern part of Santa Barbara county below:
By overlaying the twitter dataset with this map I can look at the number of tweets per area, types of tweets (nature or not) and who is tweeting/visiting these areas. This chart shows the top 20 most popular tweeted-from sites. The green highlighted portion represents nature-based tweets. The number indicates what percentage of all tweets are nature-based at each site. Names in bold indicate over 50% of tweets are nature-based.
One surprising thing is the most tweeted from place is Manning Park in Montectio. Even though I’ve lived in Santa Barbara for 9 years, I had never heard of this small park! I dug into this and it looks like the default geotag for “Montecito, California” uses a coordinate that just happens to fall within the park boundaries, which explains why we see a smaller proportion of nature-based tweets from this “nature-based area”.
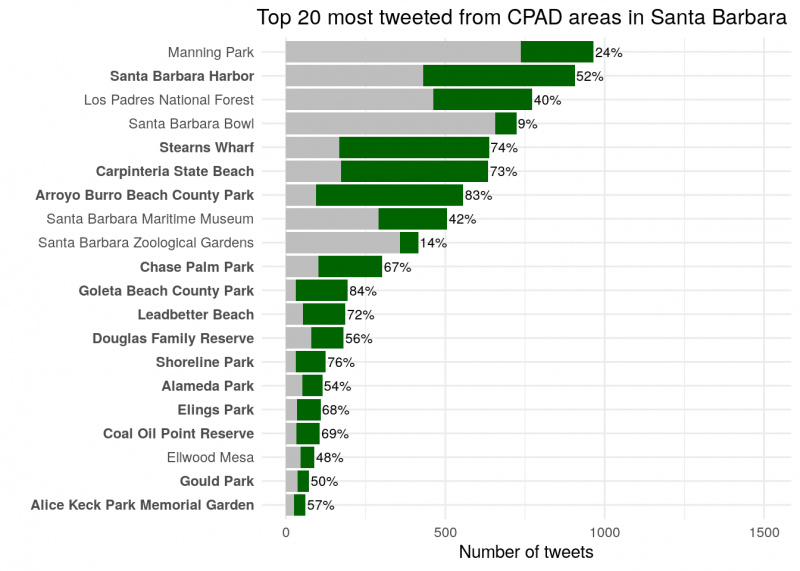
What I take away from this is that most of the designated CPAD areas have a majority of nature-based tweets, indicating that most visitors to these areas are there to engage with nature.
Do tourists and locals visit the same or different natural sites?
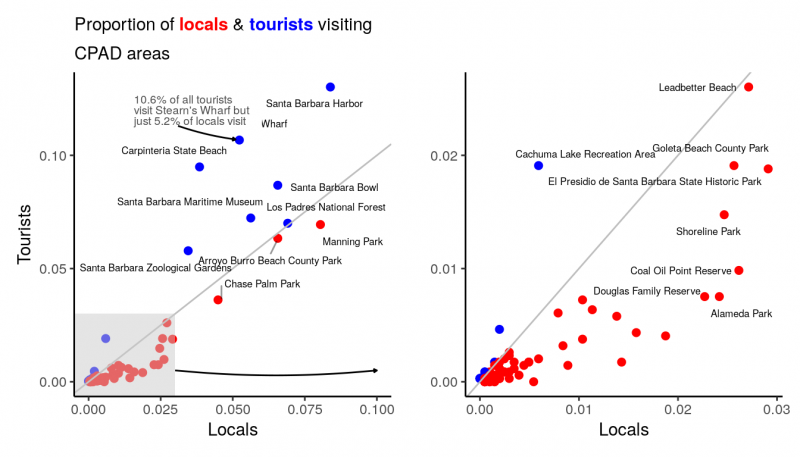
Going a bit further, I also looked at number of unique visitors to these CPAD sites. By calculating the proportion of unique tourists and locals that visit these sites, we start to look at who goes where. This is not limiting tweets to only those that are nature-based.
At the lower end we see more locals than tourists visiting these sites. These tend to be less popular areas. On the upper end, we see sites that are more frequented overall, and more frequented by tourists. These include well-known areas like the Santa Barbara Harbor and Stearn’s Wharf. Those on the lower end that locals frequent more are either lesser-known (Shoreline Park, Alameda Park are both neighborhood parks), or further from main tourist areas (e.g. Goleta Beach)
Sentiment Analysis
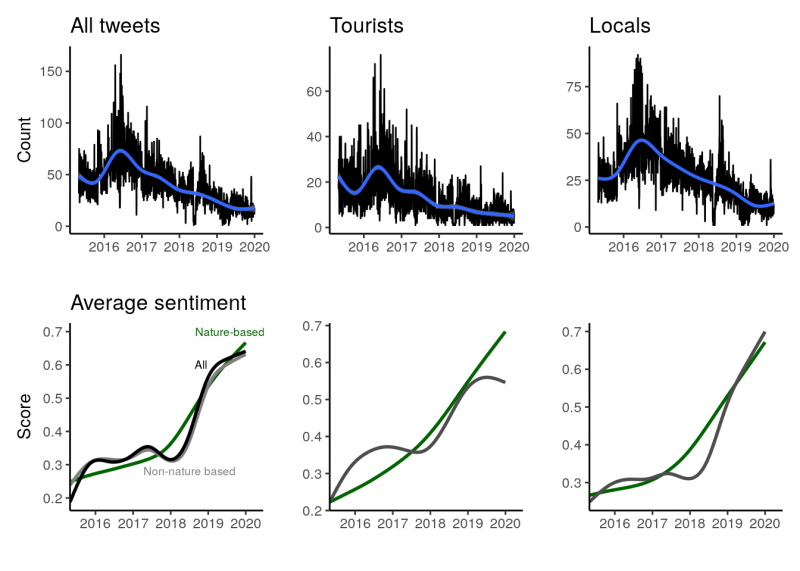
Lastly, I wanted to do a sentiment analysis to see if the general feeling of nature-based tweets was positive/negative and how they are changing over time. Using the tidytext package, I applied a general sentiment lexicon called bing to every single tweet in the dataset. The bing lexicon “categorizes words in a binary fashion into positive and negative categories”. From here we can look at averages over time. While there are expected fluctuations in tweet sentiments day by day, I applied a smoothed mean for a better look at changes over time.
The top graphs show the total number of geotagged tweets, which has gone down over time across all groups. The bottom graphs shows average daily sentiment scores over time. Above 0 is positive, below 0 is negative.
We see that on average tweets from Santa Barbara are positive and continue to grow in “positivity” over time
What are people tweeting about?
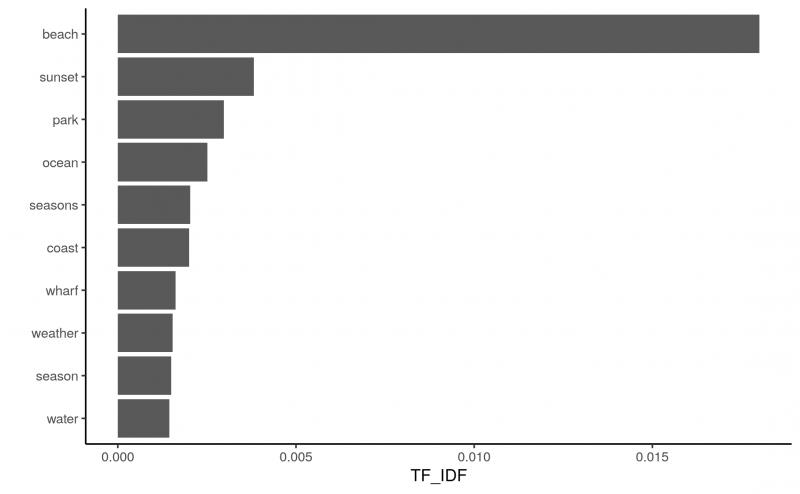
To see what people are tweeting about I applied a Term Frequency-Inverse Term Frequency (TF-IDF) analysis, which identifies words within tweets that are not only most common (e.g. “the”, “to”, “santa barbara”), but most “important”. TF-IDF is measure of how important a word is to a document in a corpus of documents, or in this case how important a word is to all nature-based tweets.
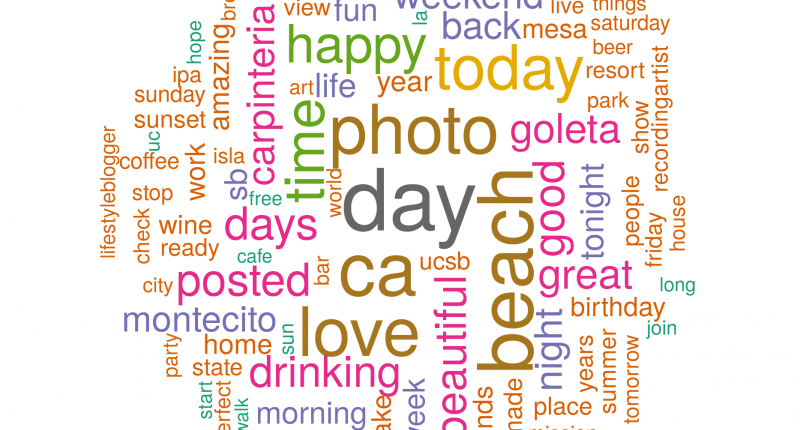
Clearly beach is the winner here!
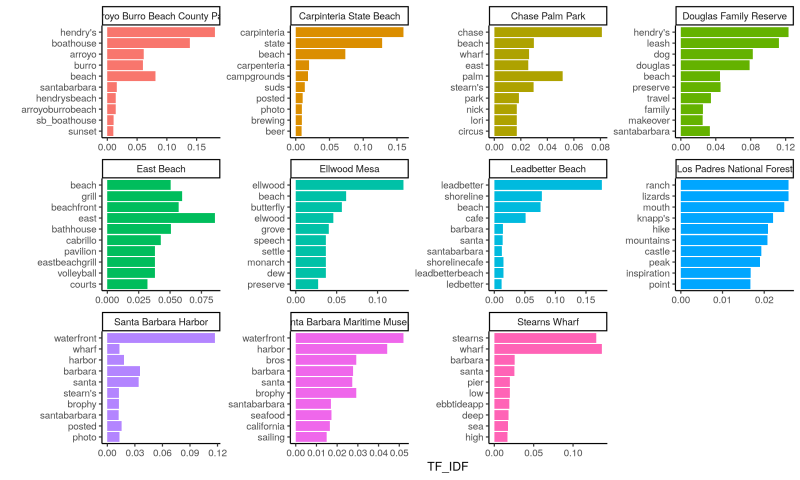
I applied the same analysis to each CPAD areas. Admittedly, this will be most interesting for people familiar to Santa Barbara. Douglas Family Preserve is a known off-leash dog park, which is why we see “dog” and “leash” at the 2 and 3 spots. Ellwood Mesa has a small Monarch butterfly preserve, hence the presence of “butterfly”, and East Beach is the place to go to play beach volleyball.
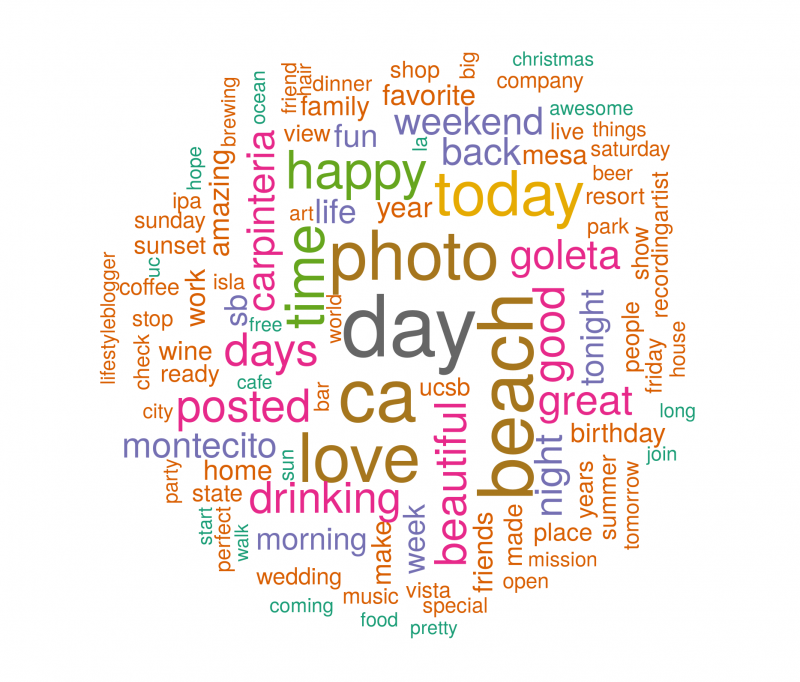
And finally, I couldn’t end the project without doing a wordcloud for all of Santa Barbara!
Closing thoughts
Geotagged social media data in conservation
Geotagged social media data has been used in recent years to study people’s interaction with the natural environment in various ways, many of which are focused on tourism:
- Quantifying nature-based tourism ( Wood et al. 2013, Kim et al. 2019)
- Mapping tourist footprints ( Runge & Daigle 2020), flows (Chua et al. 2016), and hot spots (Garcia-Palomares et al. 2015)
- Understand tourist preferences in nature based places such as Kruger National Park (Hausmann et al. 2017, Levin et al. 2017, Tenkanen et al. 2017)
- Monitor and measure environmental conditions of places (e.g. Great Barrier Reef, Becken et al. 2017)
This project differed in that I wanted to map the spatial patterns of tourists and locals, and understand how these two user groups engage with and perceive the natural environment of Santa Barbara.
Future research opportunities
Applying the same or similar method to other regions of different geographic and population sizes could reveal more interesting information and provide context for the patterns and trends we see in Santa Barbara. We might expect the tourist/local alignment to differentiate when looking at highly urban areas (LA, San Francisco), show more alignment in other suburban areas (e.g. Santa Cruz), and maybe not exist in rural locations.
By making comparisons to more rural and urban regions, we could start asking if Santa Barbara is unique in that:
- tourists and locals have similar spatial patterns
- 24% of all geo-tagged tweets are nature-based (seems high!)
- the proportion of nature-based tweets is increasing as geotagged tweets decrease overall, and positive sentiment is increasing over time
If we look at proportion of tweets that are nature-based across these rural-suburban-urban scales, we may reveal where sentiments or Sense of Place around the natural environment are higher or lower. For example, we would expect a lower proportion of nature-based tweets in New York compared to Santa Barbara. We could also compare the city to state level. Across all geotgagged tweets in California, what is the proportion of nature-based tweets?
Areas for refinement
If this method is replicated going forward, there are a few areas where refinement and better data could be improved.
Identifying tourists and locals
If I had access to a larger twitter dataset, I could identify where tourists are “from” (or where they tweet more consistently) to confirm their tourist status, instead of relying on the number of months a user tweets within an area.
Nature-based dictionary
The dictionary compiled for this project was based solely on my own perspective of nature-based words. It also leaned heavily on what I would expect people to tweet about in Santa Barbara (e.g. “lobster”, “islands”, “wharf”). Ideally a dictionary used to identify nature-based tweets would be developed using more robust methods across a more geographically representative area.
Spatial data for natural areas
The CPAD dataset is good but not perfect. Some place names needed to be edited and some polygons needed to be fixed. This would not have been possible without extensive local knowledge of Santa Barbara. To scale this analysis to larger areas, you would want to ensure the underlying “natural area” dataset is appropriate.
Bias in data
There is inherent bias in using social media data to draw broader conclusions about a community. Not everyone has access to social media or uses social media in a similar manner. There are differences across all demographics (genders, ages, ethinicities, economic status) and these were not taken into consideration during this project but should be considered if this is to be expanded upon. There are also differences in who decides to make their account public and explicilty chooses to geotag their tweet (Sloan & Morgan 2015).
All code is available at this github repo. Twitter data is kept offline and secure at the National Center for Ecological Analysis & Synthesis.