The Global Ocean Health Index Celebrates Its 10th Birthday!
The Ocean Health Index team is proud to announce our 10th (!) year of measuring the state of the world’s oceans.
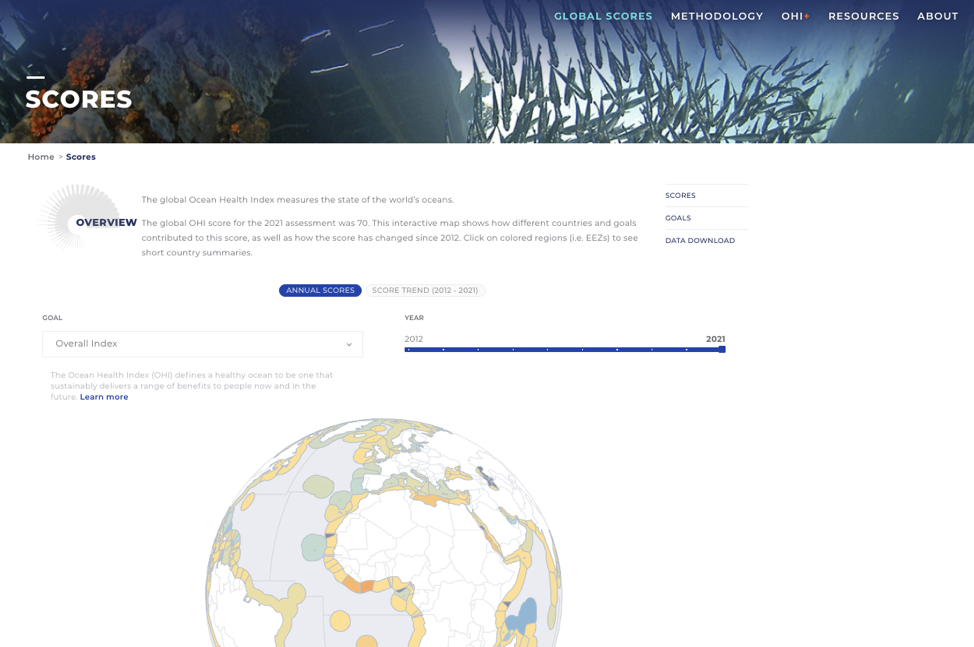
The global Ocean Health Index (OHI, for short) measures how well we are managing the sustainable delivery of 10 benefits, or goals, that people want and need from the ocean. We invite you to visit the new Ocean Health Index website (which, if you are reading this, you are already on) to explore country and goal scores, see how scores are calculated, and learn more about conducting your own Ocean Health Index assessment!
We invite you to visit the new Ocean Health Index website to explore country and goal scores, see how scores are calculated, and learn more about conducting your own Ocean Health Index assessment!
As usual, the 2021 assessment includes a new year of data, calculated using the most recent data available from agencies and other sources. Given our commitment to using the best available science, we also updated previous years’ scores (2012-2021) using the latest science and data when available. As always, the data and code underlying these results are publicly available (Data preparation and Score calculation).
This year’s assessment was led by Gage Clawson, Melanie Frazier, and Ben Halpern. Robyn Thiessen-Bock and Thomas Thelen led website design and development.
OVERVIEW OF RESULTS
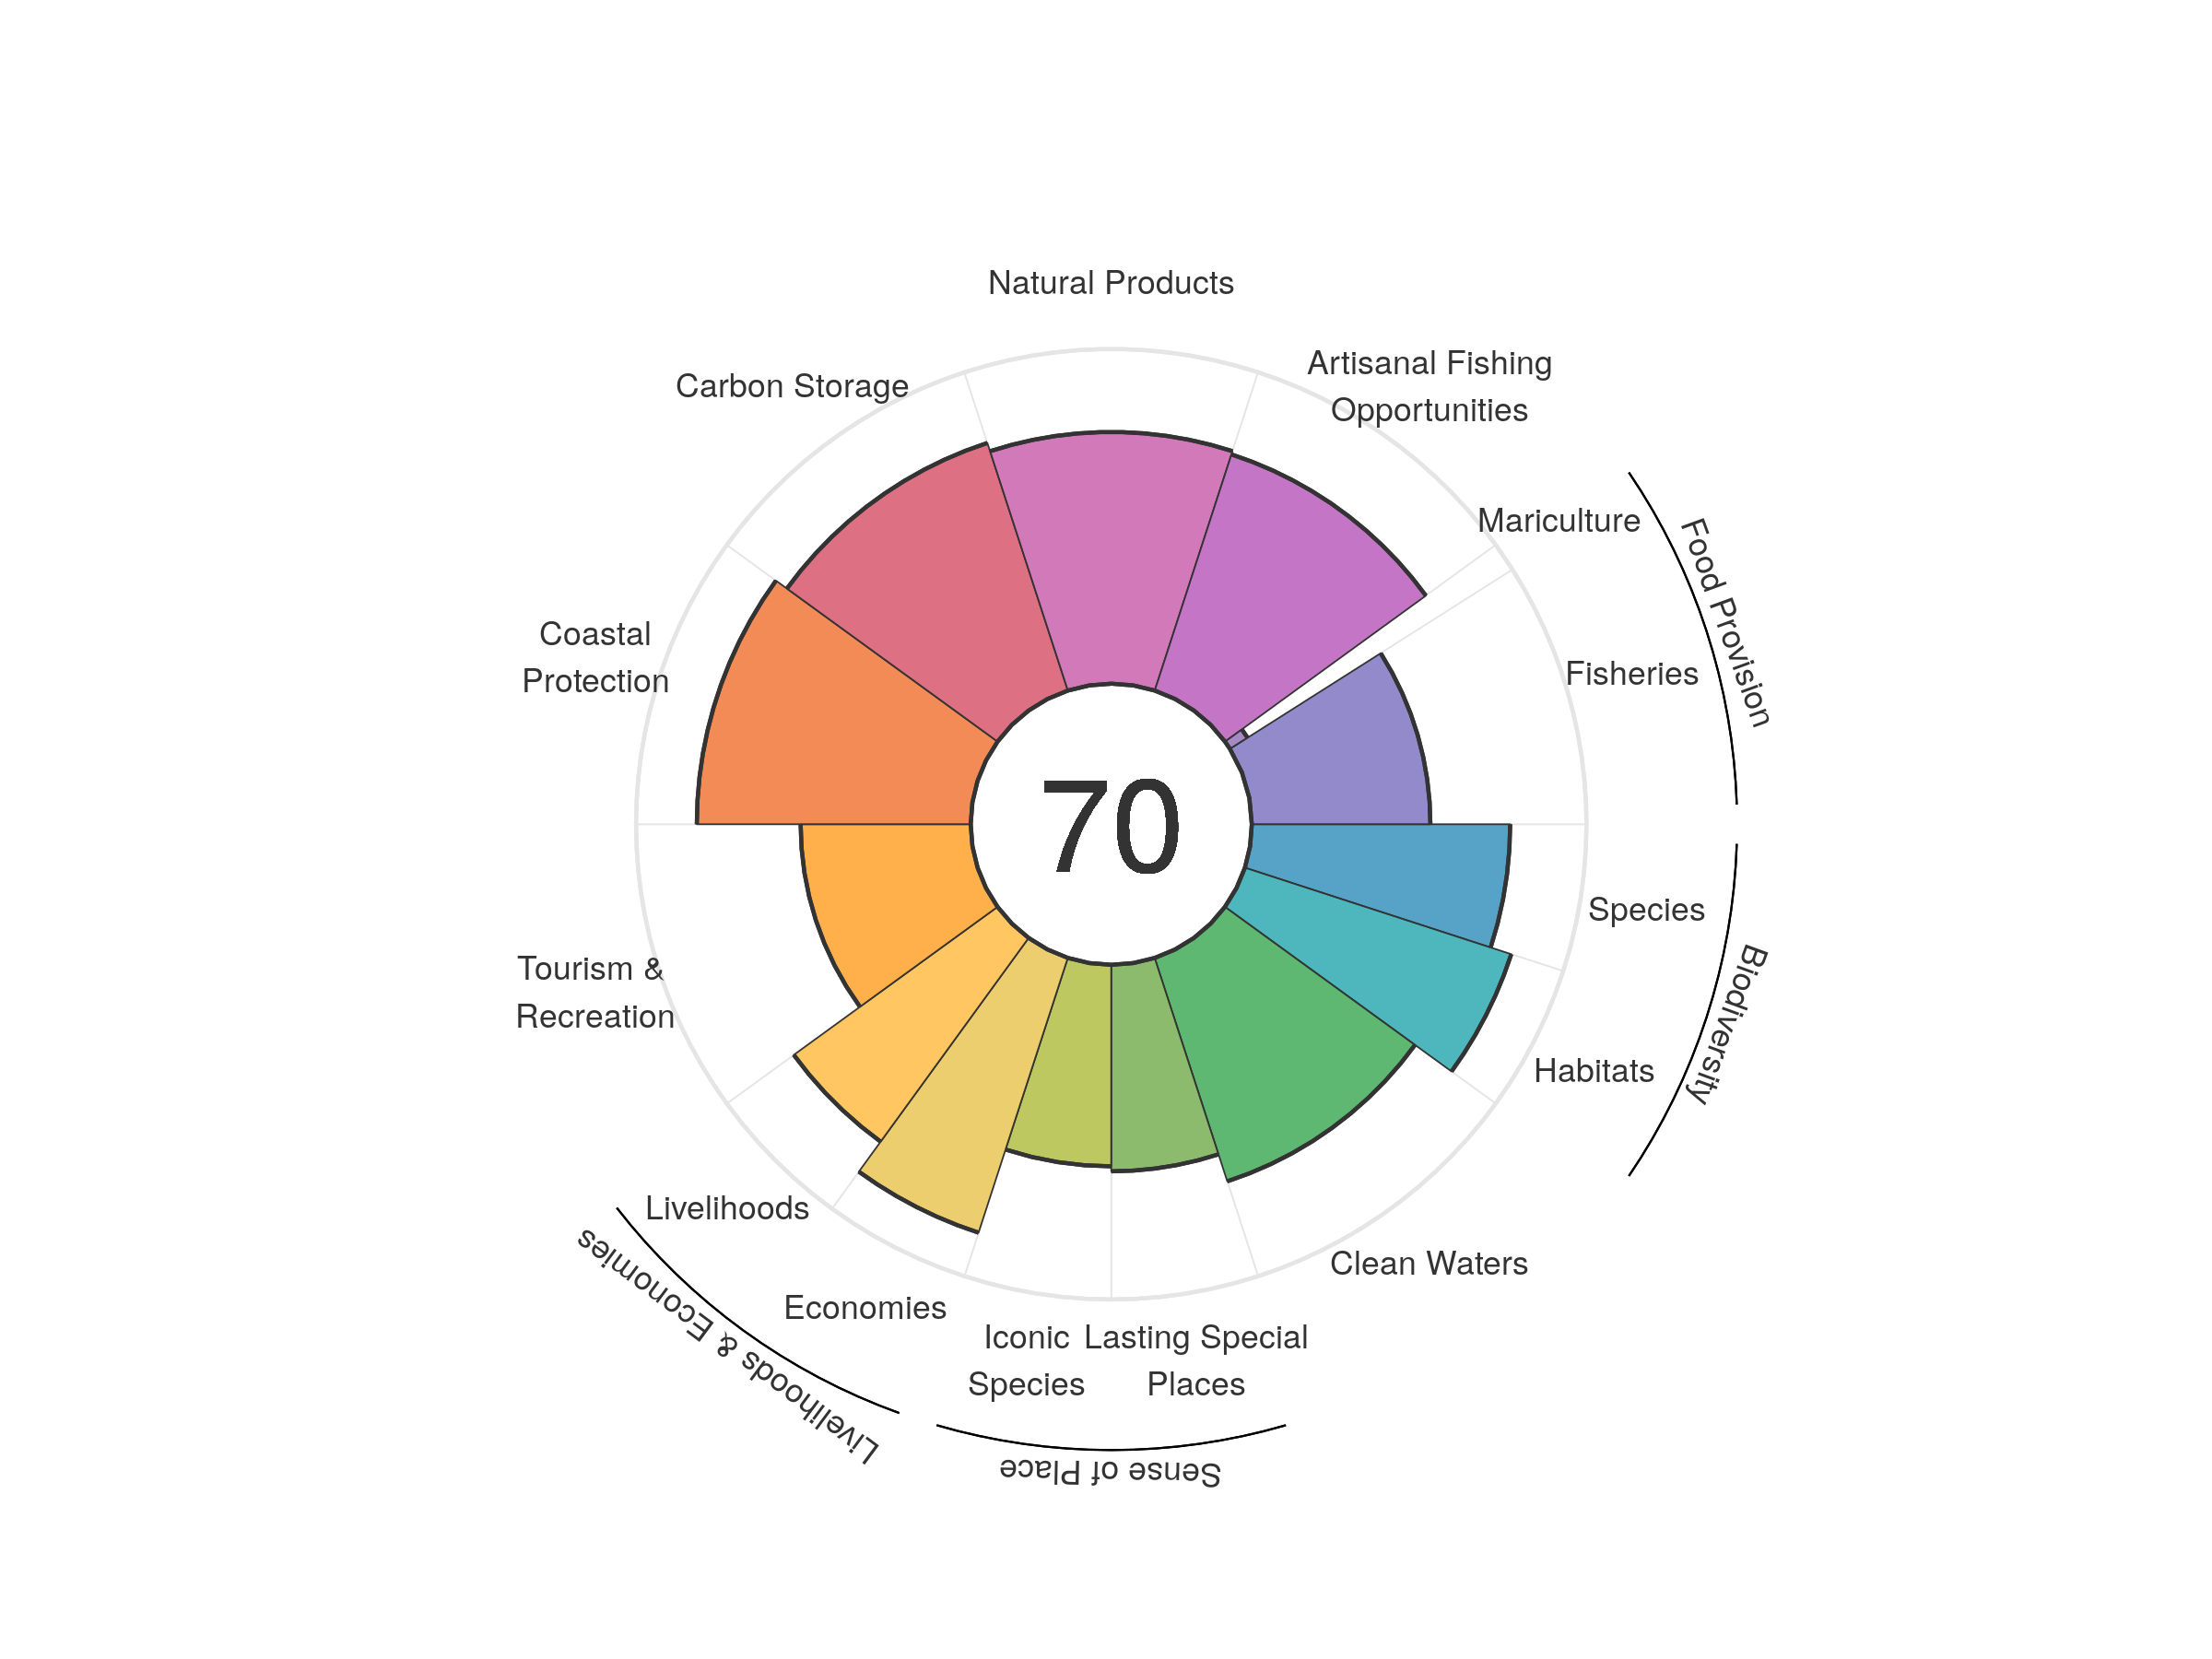
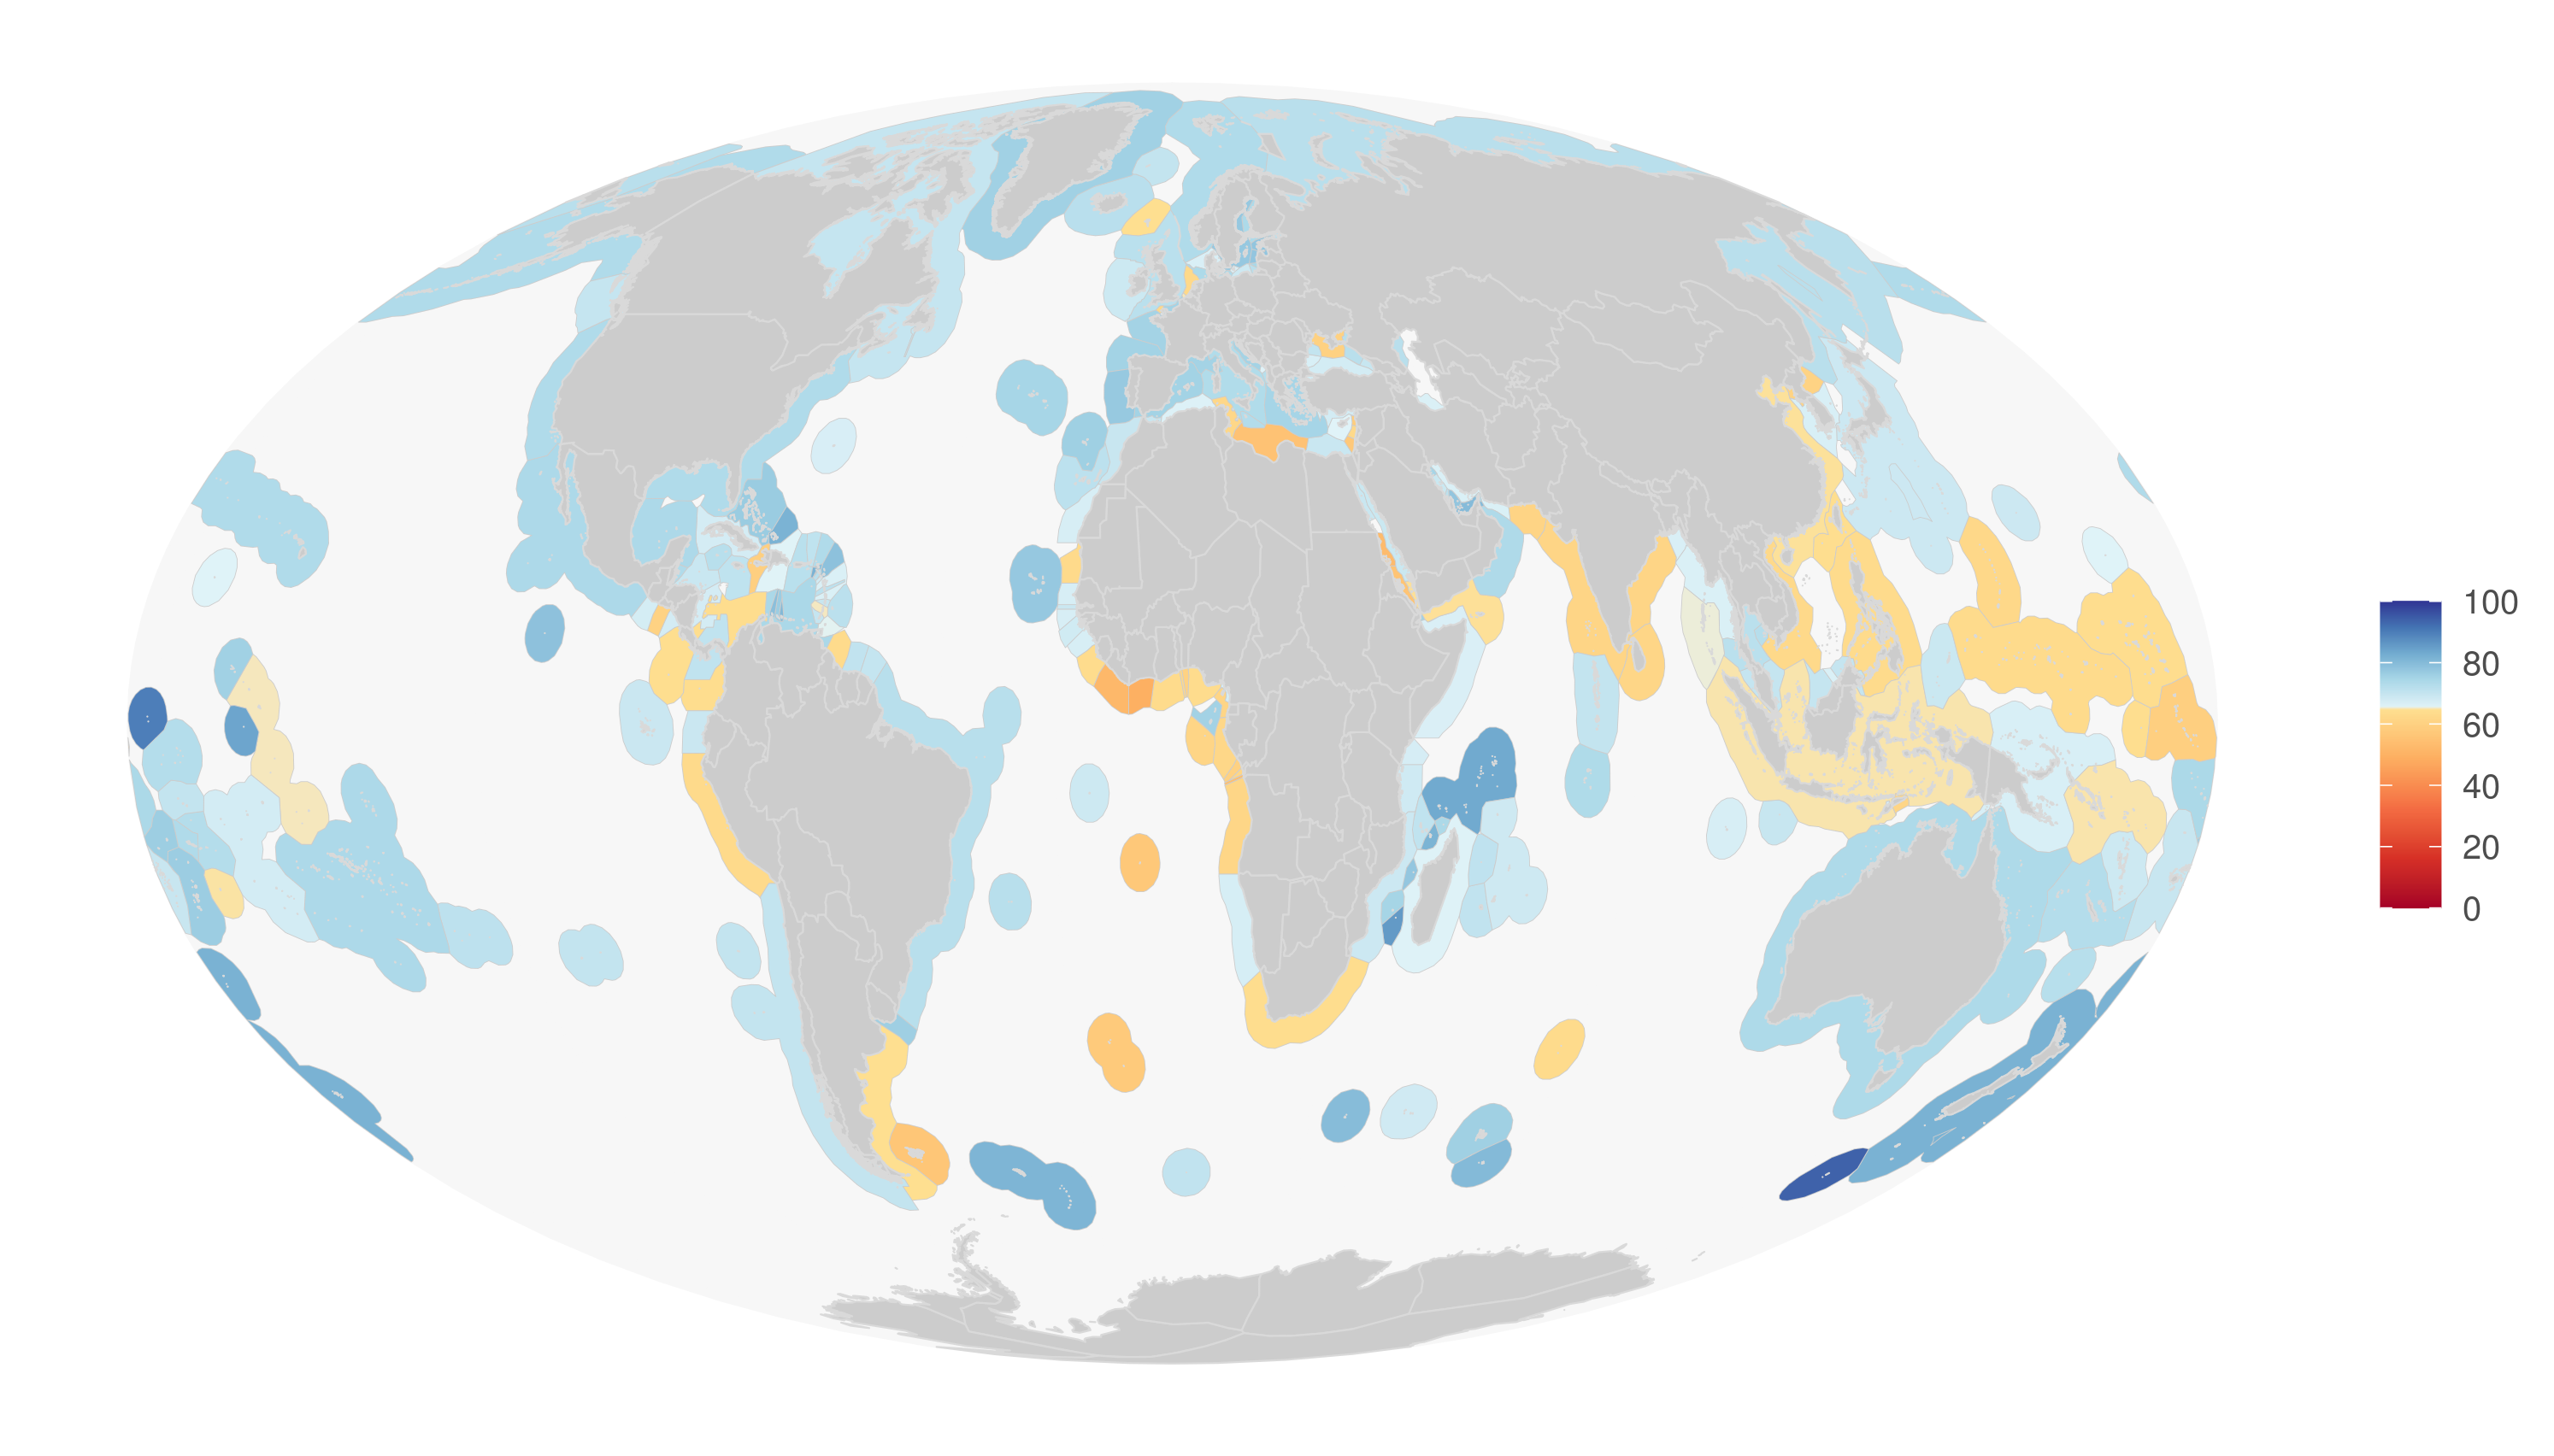
The overall global index score was 70 (Figure 1), which is similar to previous years. The regions with the highest scores tend to be uninhabited, or low human population, islands, although Portugal, Sweden, and the United Arab Emirates also have relatively high scores (Figure 2). Regions with low scores tend to be in Africa, Latin America and the Caribbean, and Asia.
Although overall index scores have hovered around 70 since 2012, a deeper dive into the index reveals some interesting trends and patterns.
Scores for many regions are reasonably good, and global scores have overall increased since 2012 for some goals, such as: tourism and recreation (although we were unable to incorporate the consequences of Covid because these data are not yet available), sense of place, and clean waters. However, we observed some worrisome patterns for fisheries, iconic species, and species condition, all of which had the lowest reported scores since the start of the Index in 2012.
Check out our detailed blog post for more in-depth analysis of our results and what they mean for ocean health around the world: https://oceanhealthindex.org/news/2021-scores/