How Big Data and Team Science Are Helping Hawaii Navigate toward Sustainable Oceans

Story cross-posted on Open Channels
It’s a no-brainer that science is critical for managing ocean resources, but actually applying science in ways that are useful to managers is not always easy. Differences in pace, scale, and priorities can thwart a clean science-to-management application.
This is not a story about the magic solution for this predicament (sorry), but it is a story about how the power of connection – specifically between data and people – can be a key ingredient.
It doesn’t hurt that this story takes place in Hawaii, whose magical waters draw people in droves. In 2017 alone, 9.4 million tourists generated nearly $17 billion in direct tourism revenue for the state, and 89 percent of its residents participate in ocean activities at least once a month.
In recognition that nearly everything about their island life depends on the ocean, the state government has made a string of commitments to the betterment and protection of its marine resources.
The culmination of these commitments is its Aloha+ Challenge, a 2016 proclamation by Governor David Ige to achieve a set of sustainability goals by 2030 that essentially localize the United Nation’s Sustainable Development Goals. One of those goals is to “effectively manage” 30 percent of Hawaii’s nearshore waters by the deadline, what is known as the 30 by 30 target.
“What that means in practice is that there’s a shared north star that we’re navigating towards,” said Jack Kittinger, Conservation International’s Senior Director of Fisheries and Aquaculture and a Hawaii resident.
For two teams of scientists, both of which Kittinger was part, the timing of the Aloha+ Challenge was serendipitous. They were in the midst of separate-but-related projects, called Ocean Tipping Points and the Ocean Health Index, which were applying a big-data and team-science approach to understanding ocean sustainability in Hawaii, and their work has since been helping to navigate the way toward that north star.
Both teams collaborated across institutions, islands, and even time zones to compile and analyze the many datasets on Hawaii’s ocean ecosystems that already existed, an approach called synthesis science. By connecting data and people, the teams have been able to piece together some bigger picture understandings about Hawaii’s marine resources and how to sustain them, which has in turn helped them align their work with the state’s priorities.
“[Synthesis science] allows us to ask questions that you cannot ask at an individual site or about an individual year or issue. You can see the bigger picture of interactions and understand those trends, and make decisions at scale,” said Kittinger.
A case in point are Hawaii’s coral reefs, which were under the proverbial microscope for Ocean Tipping Points. The project applied a concept arguably made famous by writer Malcolm Gladwell – that a small shift can lead to dramatic changes in a system – to identify thresholds that indicate a reef ecosystem may be teetering on the edge of a significant shift, and which managers could use to triage their interventions.
“We often have trouble keeping a pulse on the entire ecosystem, and it’s a way of looking at what’s most important, the big-picture changes that we want to either avoid or create,” said Kim Selkoe, a senior fellow at the National Center for Ecological Analysis and Synthesis who led the project’s work in Hawaii.
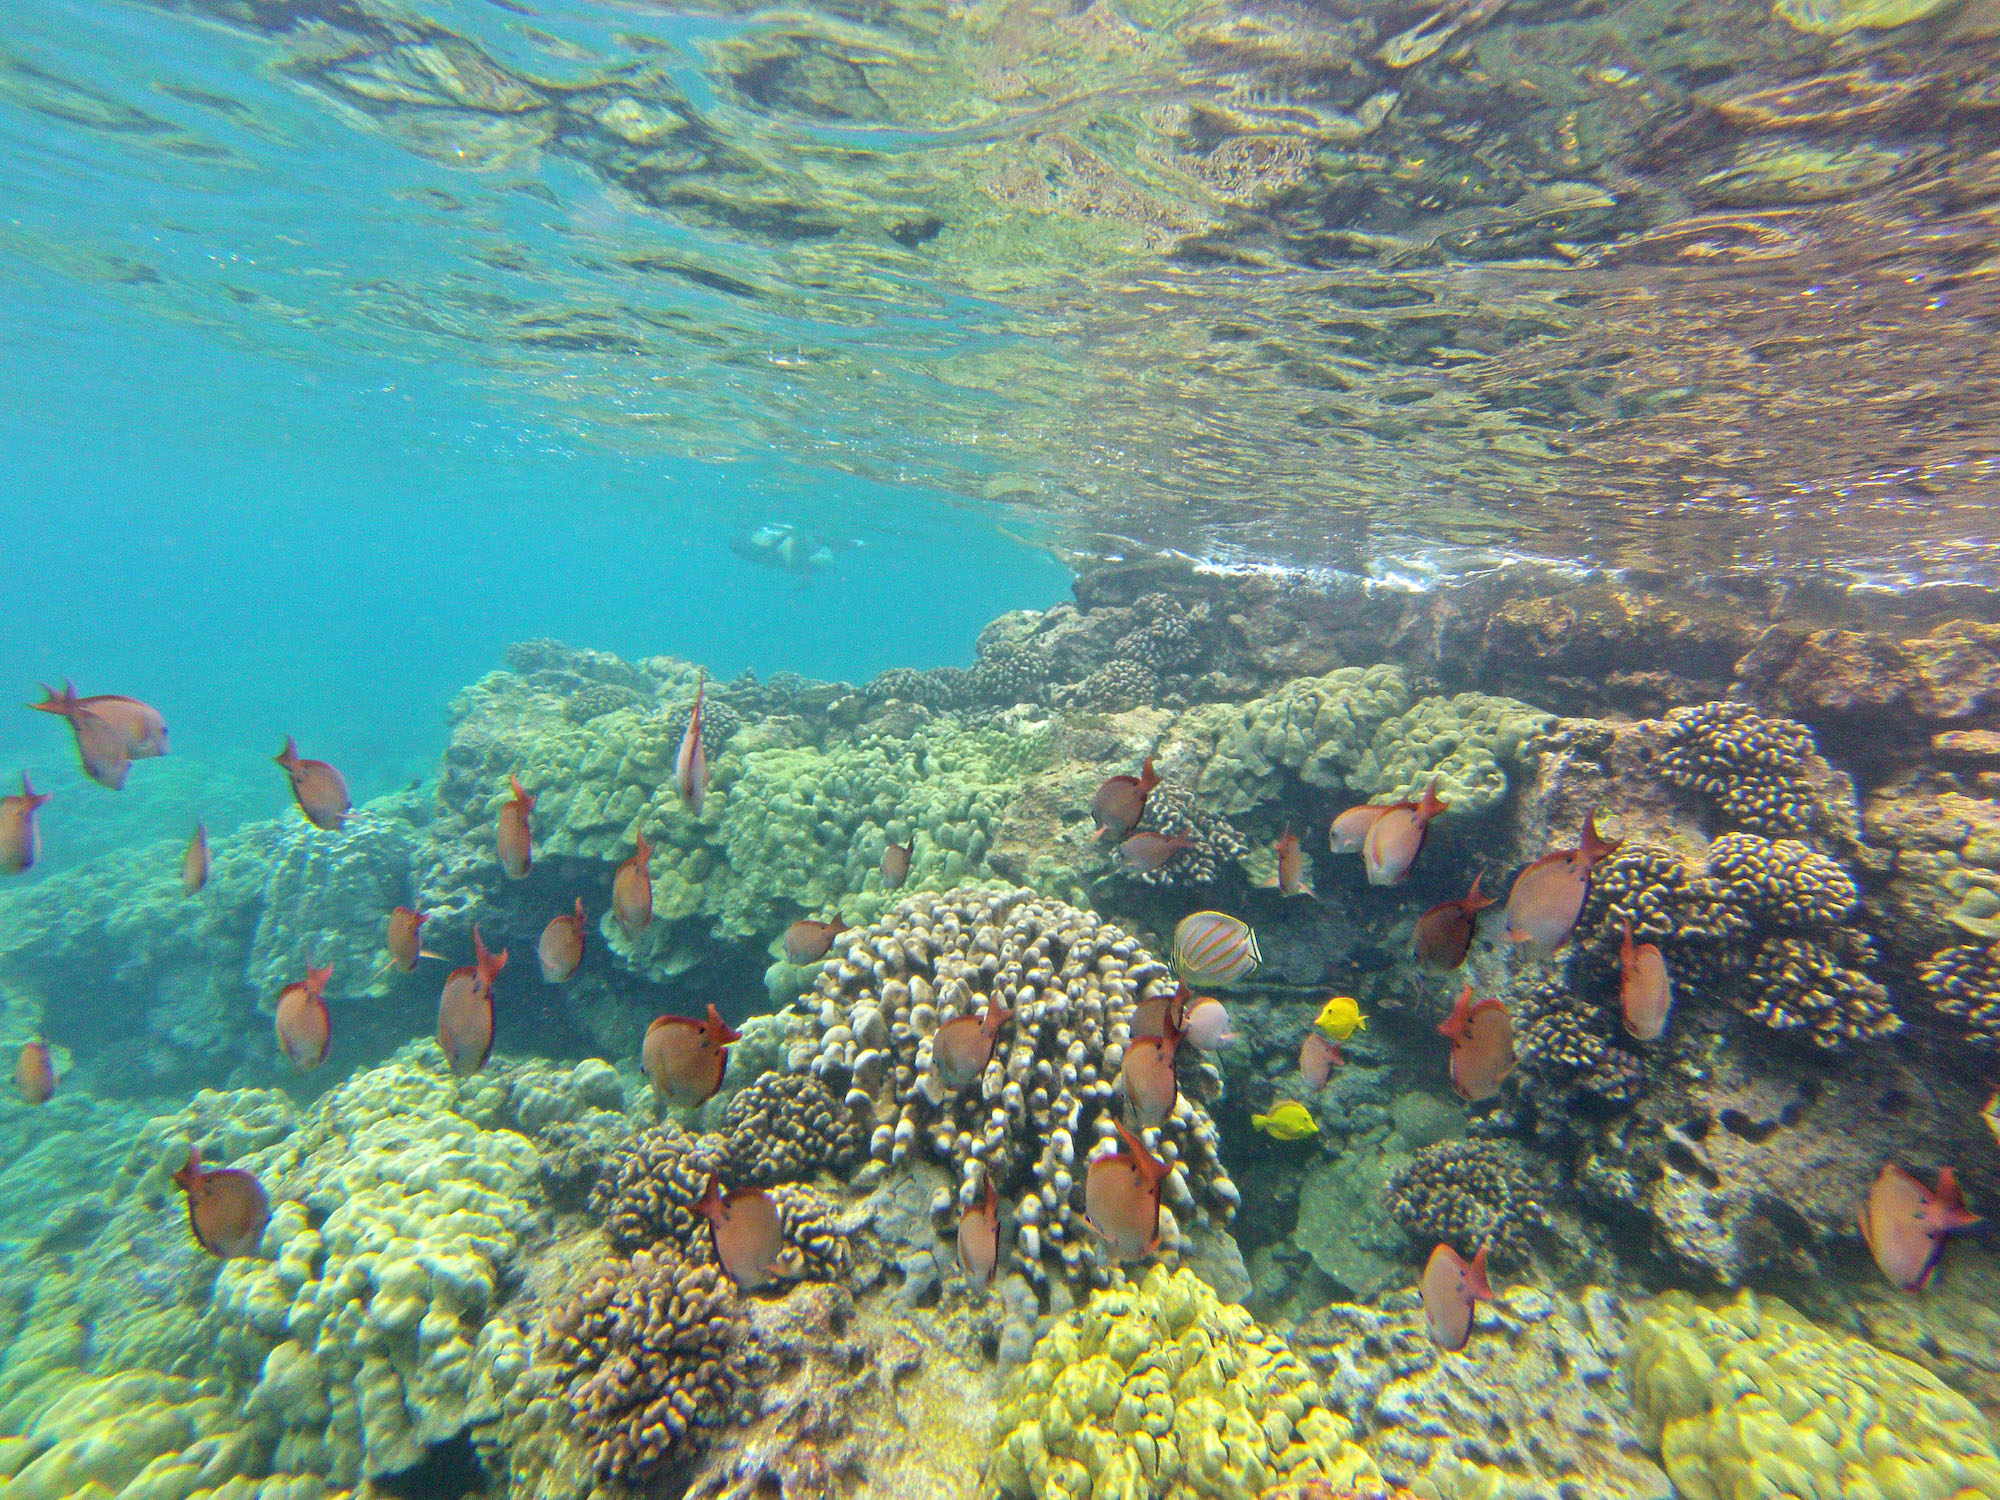
Coral reefs are a poster child for tipping points. From 2014 to 2015, El Niño caused an ocean heatwave that brought about the first statewide coral bleaching event in Hawaii’s history, blanching nearly half of its reefs and sounding a wakeup call about their vulnerability.
Hawaii’s reefs also happen to be some of the best studied in the world, making them ripe for synthesis science about tipping points. Roughly 5,000 sites around the islands have associated scuba survey data that provide snapshots of the in-situ state of reefs, algal cover, and the amount and diversity of fish.
But when the Ocean Tipping Points project began, those thousands of reef transects, each one pixel’s worth of the big picture, were scattered among numerous agencies and organizations that had used varying data collection techniques – a problem certainly not unique to coral reef data and one that can impede the ability to make timely decisions.
“It can be hard for managers when they’re getting a bunch of different stories and they’re not sure how to piece them together,” said Mary Donovan, a postdoctoral researcher at UC Santa Barbara who was part of Ocean Tipping Points.
A PhD student at the time, Donovan led the challenging process of organizing all those data into one place and calibrating them into a first-ever, unified dataset on the state of Hawaii’s reefs and associated fish communities across its main islands. This collection, along with a second dataset on human and environmental impacts to reefs also compiled by the project team, now provide a comprehensive scientific foundation on which managers can find consensus and act.
Using these data, the team has also generated findings that could eventually help managers prioritize which reefs to protect under the 30 by 30 target and how. They’ve identified five different states of reef health with varying degrees of susceptibility to a tipping point and of potential for recovery, as well as what biophysical factors or human activities may be at play, findings which can point to where management actions will reap the biggest bang for the buck.
“What we’ve heard is that [these datasets] help managers feel optimistic about doing some meaningful rule changes, whereas before they felt like they didn’t have the scientific resources and backing to be able to go through a process that would be defensible and scientifically informed,” said Selkoe.
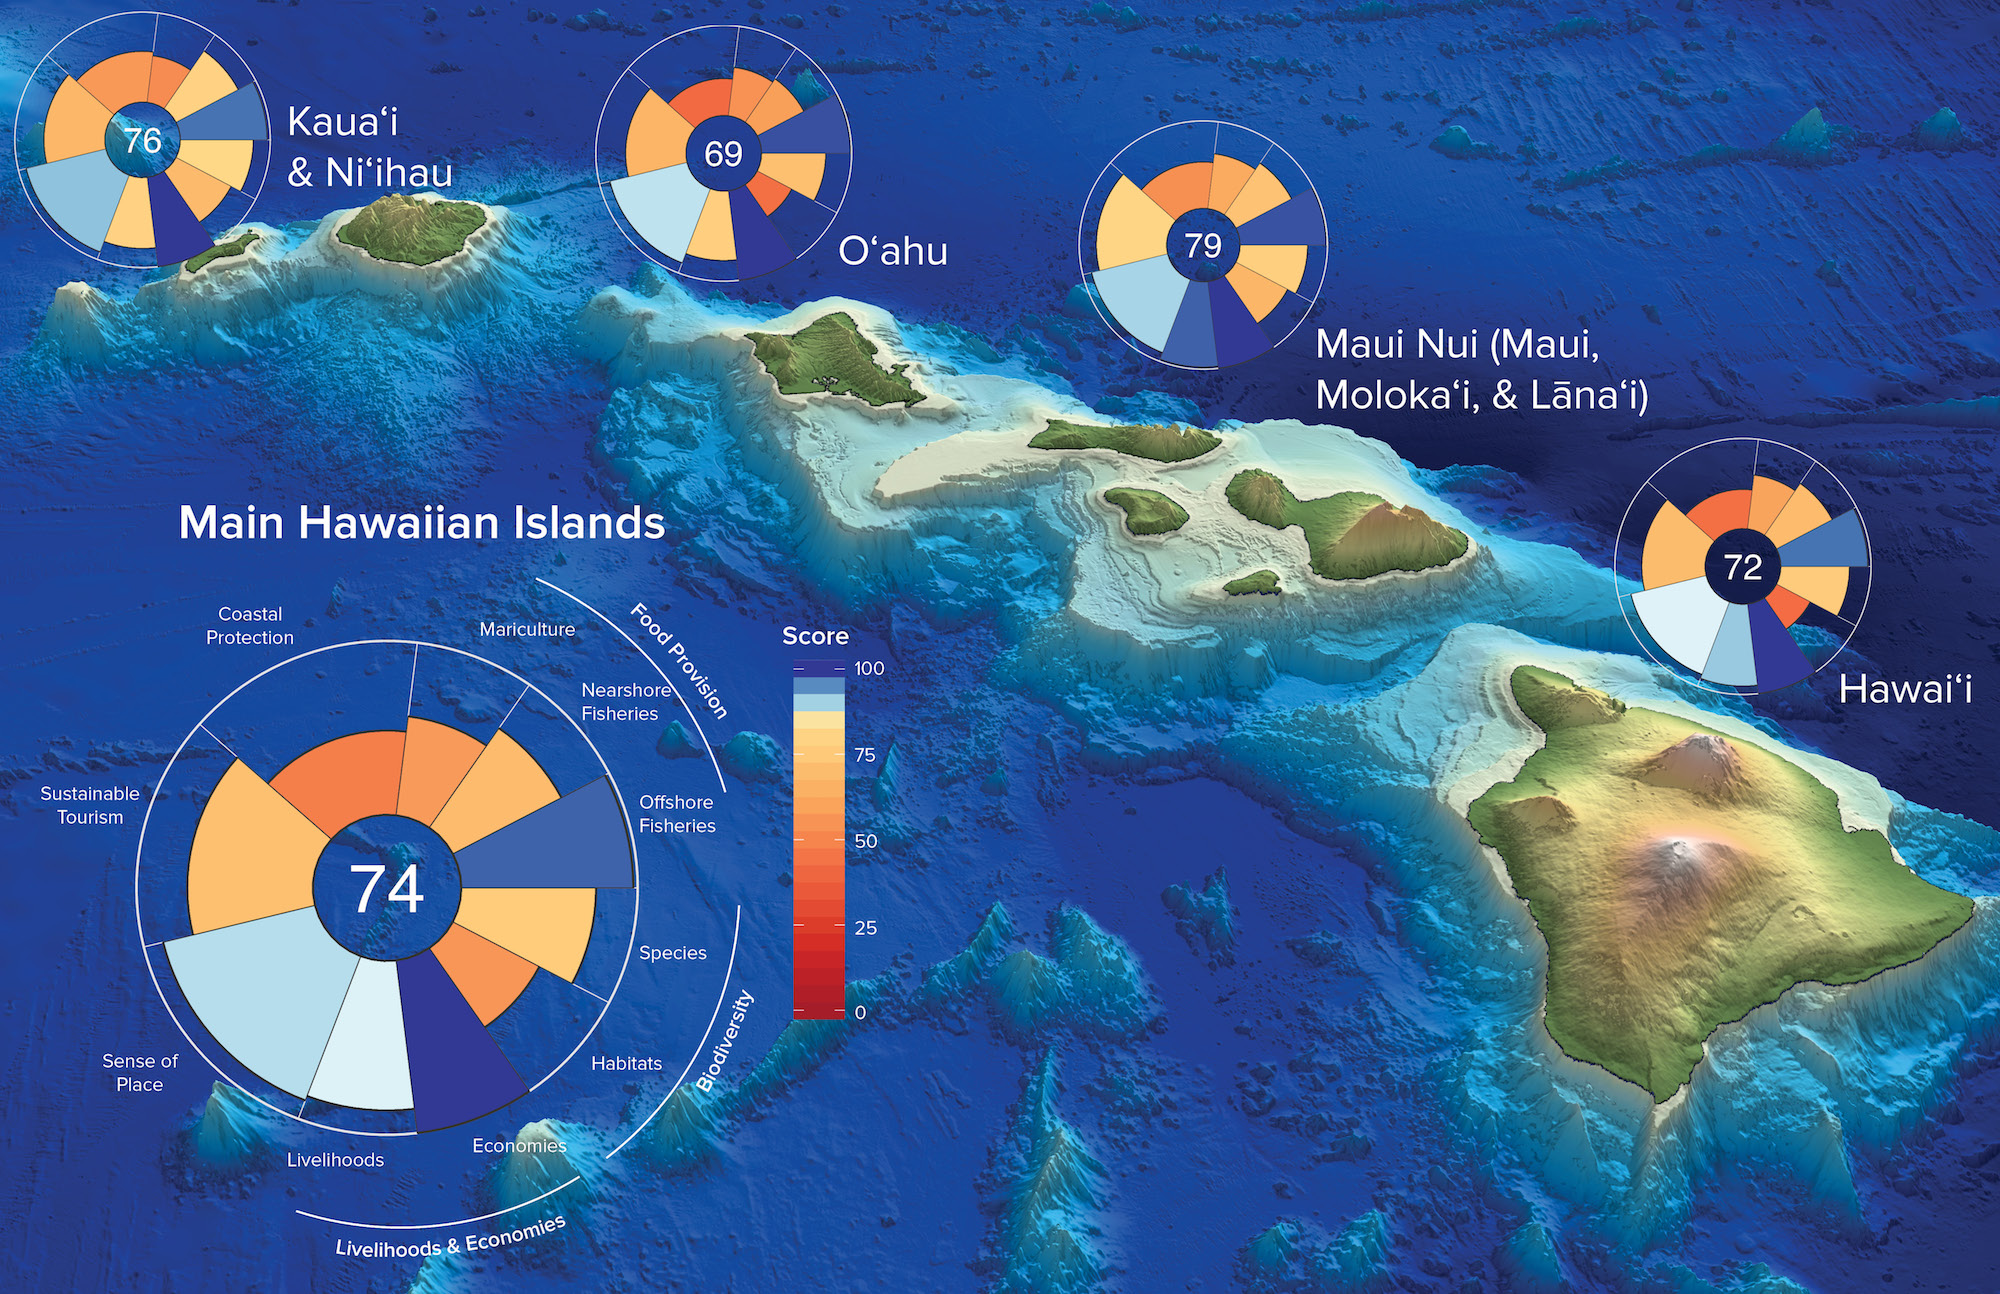
The datasets were also among those incorporated into the Ocean Health Index, which underwent its own, yet complementary data synthesis process. A veritable health assessment for oceans, the Index zooms the lens out and pulls in the available economic, social, and ecological data to measure progress toward locally specific goals that reflect the many benefits people get from healthy oceans, from habitat quality to sustainable tourism and a sense of place.
The assessment results in “scores” for ocean health – Hawaii’s overall score was 74 out of 100 – numbers that have become starting points for the state’s sustainability initiatives, especially the Aloha+ Challenge, which is now using the project’s metrics as part of its dashboard for tracking progress.
“It will help us see if management is being effective in helping to increase ocean health in Hawaii, and if not, what other priorities should we suggest or communicate to our stakeholders to help reach the future commitments for the state,” said Eva Schemmel, a science advisor at Conservational International who led the Hawaii assessment.
Wrangling data had another beneficial and perhaps transformational outcome: social capital. The Ocean Tipping Points and Ocean Health Index teams put a tremendous amount of effort into ensuring they gathered the right people around the table, and the resulting relationship infrastructure helped them build trust and common ground.
“Almost more frequently than we were talking about our science, we were talking about how it was going to be useful,” said Donovan, explaining that frequent meetings with managers and open lines of communication helped the Ocean Tipping Points team design the research to meet management needs.
The Ocean Health Index built onto this relationship infrastructure by involving people whom the research will affect – such as business leaders, indigenous leaders, and ecotourism operators – in addition to the experts and managers, creating a shift in communication that is helping to clarify the message about Hawaii’s ocean health.
“It basically sets the stage for this collaborative conversation,” said Schemmel. “It’s all about how we communicate and message on a larger level, and how we set our priorities together.”
And this clearer, more cohesive message is serving as persuasive fodder for decision-making in the state.
According to Brian Neilson, acting administrator of Hawaii’s Department of Land and Natural Resources’ Division of Aquatic Resources, which is in charge of achieving the 30 by 30 target, the projects have not only opened his eyes to the power of big data, but are also helping him and his fellow managers focus their actions and make the case for stronger management to sustain their marine resources.
“The Ocean Health Index and Ocean Tipping Points really put us far ahead in the planning stage, of knowing the state of the resources and the state of the impacts, and helping us set some achievable goals,” said Neilson.
# # #
NCEAS co-led both the Ocean Health Index Hawaii Assessment and Ocean Tipping Points project. Its partner for the former was Conservation International, and it had many collaborators on the latter.
The best links for learning more about the projects include the tools produced by the Ocean Tipping Points and its Hawaii data, and the Ocean Health Index’s website designed to help ocean managers conduct regional assessments, as well as its Hawaii assessment.